B-Cubed's six-part training series held over consecutive Fridays brought together a global audience for interactive sessions combining expert presentations, live Q&A, and hands-on practice with tools and workflows. The series attracted over 380 participants, representing 65 countries worldwide. Attendees reflected a diverse career stage mix, led by PhD candidates (23%), Early-career professionals (18%), and senior experts (16%). The audience also spanned multiple sectors, with the largest groups coming from academia and higher education (32%) and research institutes (26%), followed by government, consultancy, NGOs, and industry.
Below, you can access the slides, recordings and Q&A for each session.
20 February - Species occurrence cubes
GBIF has recently enabled a simple, easy-to-use service for creating and downloading species occurrence cubes from GBIF-mediated data using SQL queries. This session gave an overview of the service with some examples.
27 February - Occurrence cubes and biological invasions
Sandra MacFadyen (Stellenbosch University) presented the Invasibility Cube, while Maarten Trekels (Meise Botanic Garden) focused on the possibilities of the b3alien Python package, providing a technical solution to track Target 6 of the KM-GBF.
6 March - Indicators for national invasion reporting
South Africa has set up a process of reporting on the state of biological invasions every three years (https://iasreport.sanbi.org.za/). This session presented the process used to compile the reports, how this has evolved over time, and highlighted lessons learnt and challenges encountered.
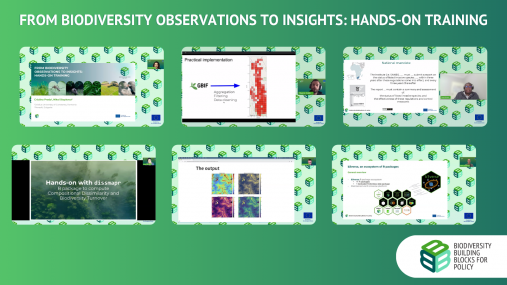
13 March, - Automating compositional dissimilarity and biodiversity turnover mapping with dissmapr
This session presented dissmapr, an open-source R framework that automates compositional dissimilarity and turnover analysis. Applied to butterfly assemblages across South Africa, dissmapr reveals species-sharing patterns overlooked by conventional approaches and produces outputs that can be directly aligned with protected area networks to identify compositional fragility, anticipate climate-driven change, and prioritise monitoring.
20 March - Making use of colorblind friendly maps
This session highlighted the importance of colouring maps for daltonic people, going over good practices and coding solutions.
27 March - The b3verse: an R package suite to process cubes and calculate indicators
The b3verse is a comprehensive suite of interconnected R packages. Тhis webinar introduced these packages and showcased how they can be used to retrieve, process, explore occurrence cubes, and how to calculate indicators.
You can access all our tutorials and guides on our documentation website: https://docs.b-cubed.eu/.