B-Cubed’s training series will showcase emerging approaches that help make biodiversity data more actionable in practice. Register here.
It will feature six live sessions, held on consecutive Fridays at 15:00 CET. Each session will last 1.5 hours, combining a presentation, Q&A, and a hands-on segment where participants try out tools and workflows. You can access tutorials and guides for our tools on our documentation website: https://docs.b-cubed.eu/.
Programme
20 February, 15:00 CET - Species occurrence cubes
GBIF has recently enabled a simple, easy-to-use service for creating and downloading species occurrence cubes from GBIF-mediated data using SQL queries. In this session, you will get an overview of the service demonstrated with some examples.
Led by Andrew Rodrigues (GBIF) and Lina Estupinan Suarez (Martin Luther University Halle-Wittenberg).
27 February, 15:00 CET - Occurrence cubes and biological invasions
Sandra MacFadyen (Stellenbosch University) will delve into details of the Invasibility Cube, which integrates trait, environment (and site), and community (species) data to quantify invasion fitness and generate spatial indicators of site invasibility and species and/or trait invasiveness. Maarten Trekels (Meise Botanic Garden) will present the possibilities of the b3alien Python package. The package provides a technical solution to track Target 6 of the KM-GBF. It mainly focuses on the headline indicator: rate of invasive alien species establishment, but can provide input to some of the complementary indicators.
Led by Maarten Trekels (Meise Botanic Garden) and Sandra MacFadyen (Stellenbosch University).
6 March, 15:00 CET - Indicators for national invasion reporting
South Africa has set up a process of reporting on the state of biological invasions every three years (https://iasreport.sanbi.org.za/). In this session we will present the process used to compile the reports, how this has evolved over time, and highlight lessons learnt and challenges encountered.
Led by Tsungai Alfred Zengeya (South African National Biodiversity Institute).
13 March, 15:00 CET - Automating compositional dissimilarity and biodiversity turnover mapping with dissmapr
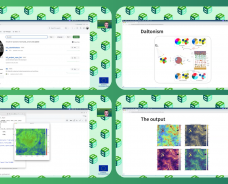
We present dissmapr, an open-source R framework that automates compositional dissimilarity and turnover analysis using ζ-diversity and multi-site generalized dissimilarity modelling (MS-GDM), integrating species occurrence and environmental data to quantify higher-order ζ-diversity decline, model compositional similarity along environmental gradients, and generate predictive turnover surfaces and bioregional maps under current and future scenarios. Applied to butterfly assemblages across South Africa, dissmapr reveals species-sharing patterns overlooked by conventional approaches and produces outputs, such as turnover heatmaps and bioregional delineations, that can be directly aligned with protected area networks to identify compositional fragility, anticipate climate-driven change, and prioritise monitoring. By providing an automated, transparent, and extensible workflow, dissmapr lowers technical barriers to advanced turnover modelling and supports evidence-based biodiversity management in SANParks and beyond.
Led by Sandra MacFadyen (Stellenbosch University).
20 March, 15:00 CET - Making use of colorblind friendly maps
This session will highlight the importance of colouring maps for daltonic people, going over good practices and coding solutions.
Led by Duccio Rocchini (University of Bologna).
27 March, 15:00 CET - The b3verse: an R package suite to process cubes and calculate indicators
The b3verse is a comprehensive suite of interconnected R packages. In this webinar, we introduce these packages and showcase how they can be used to retrieve, process, explore occurrence cubes, and how to calculate indicators.
Led by Shawn Dove (Justus Liebig University), Ward Langeraert (Research Institute for Nature and Forest) and Jasmijn Hillaert (Research Institute for Nature and Forest).