Biodiversity Building Blocks for Policy
B-Cubed’s training series will showcase emerging approaches that help make biodiversity data more actionable in practice. It will feature six live sessions, held on consecutive Fridays at 15:00 CET.
You can access tutorials and guides for our tools on our documentation website: https://docs.b-cubed.eu/.
Biodiversity Building Blocks for Policy
B-Cubed is an EU project that ran between March 2023 and August 2026. It aimed to standardise access to biodiversity data, helping transform fragmented biodiversity records into timely, policy-relevant indicators.
Data cubes and indicators
B-Cubed aimed to strengthen biodiversity policy and related decision-making by providing rapid access to pre-aggregated biodiversity data, responsive indicators, and evidence-based alert systems.
Building species occurrence cubes
B-Cubed deployed a service to aggregate species occurrence data into data cubes
ExploreModelled cubes
The data cube format serves as a basis for different models
ExploreR packages and indicators
Data cubes were also transformed into biodiversity indicators
ExploreA new format was designed to aggregate species occurrence data along geographic, temporal and taxonomic dimensions. An example is the number of plant occurrences per decimal degree, year and family. The specification describes what spatial reference grids should be offered, how to handle occurrences with a larger spatial uncertainty than those grids, and what measures to provide (e.g. count, minimum coordinate uncertainty, sampling bias, etc.). The specification also describes the service to produce such cubes.
The specification was implemented by GBIF as a new service that allows users to query and aggregate species occurrence data with the Structured Query Language (SQL). This well-known language can handle diverse and complex data operations and be used for more than the generation of data cubes. The service also provides a number of functions that shield users from having to create complex aggregation queries themselves (such as grid assignment).
Any registered user of GBIF can use the service. The easiest way to do so is through the GBIF website (https://www.gbif.org/), where one can create a cube through a series of dropdown menus and checkboxes. No SQL knowledge is required for this, but advanced users can switch to a SQL editor to customise their query further.
Users can also interact with the service programmatically using the command line interface or the updated libraries in R (rgbif) and Python (pygbif). As with other GBIF occurrence download formats, all successful queries are assigned unique and permanent DOIs. This enables FAIR citation, attributes data publishers and aids reproducibility of downstream analyses.
The Suitability Cube is a conceptual and operational framework designed to evaluate biodiversity data fitness-for-use across multiple analytical contexts. The output is a three-dimensional data cube (cell × species × time) that integrates indicators (Dissimilarity Index, Area of Applicability and Hypervolume of the species’ niche) derived from the same environmental variables used as inputs to the SDMs. This cube provides a reproducible and transparent framework for exploring how species occupy environmental space, identifying areas of high uncertainty or extrapolation, and evaluating the robustness of model predictions through space and time.
The Dissimilarity Cube is a reproducible, multidimensional framework for analysing how biological communities change across space and time. Rather than focusing on the predicted occurrence of individual species, it quantifies variation in assemblage composition, thereby providing a community-level perspective on biodiversity change.
By turning biodiversity records into mappable signals of community change, the Dissimilarity Cube helps identify stable regions, shifting assemblages, and areas at risk of ecological reorganisation. It therefore provides a scalable and policy-relevant approach for monitoring biodiversity structure, detecting emerging novel communities, and supporting spatial conservation planning.
The Network Invasibility Cube is a unified framework for assessing invasion risk by integrating three major dimensions of biological invasions: invader traits, abiotic suitability, and biotic resistance from resident communities. This allows invasion processes to be represented within a single, transparent, and interoperable modelling structure.
The Network Invasibility Cube supports surveillance, prioritisation, and management by highlighting invasion hotspots and high-risk species x trait combinations. Because the workflow is modular and reproducible, it also enables consistent comparison across taxa, regions, and scenarios.
DeepMaxent is a deep learning framework for species distribution modelling that integrates the maximum entropy principle with neural networks. Beyond classical environmental variables, it provides a flexible foundation to incorporate complex and heterogeneous predictors such as remote sensing imagery, climate projections, ecological context, and multimodal biodiversity data. The method relies on a normalised Poisson point-process loss, enabling scalable training with stochastic gradient descent and efficient multi-species modelling while accounting for spatial sampling biases. DeepMaxent improves predictive accuracy compared to classical Maxent and opens new opportunities for large-scale, multimodal biodiversity monitoring using deep learning.
By comparing status and trend estimates from aggregated data cubes with those obtained from structured monitoring data, B-Cubed developed guidelines for producing reliable indicators and trends from occurrence cubes. These guidelines emphasise the importance of clearly defining the scope of the analysis so that data are aggregated at an appropriate level, conducting an exploratory assessment of the aggregated data to identify common gaps or errors, and applying targeted filtering. All filtering, harmonisation, and data-quality decisions should be documented in a transparent and traceable manner.
The b3gbi R package is a computational tool designed to efficiently analyse large-scale species occurrence data, such as those from GBIF, to produce consistent insights into global biodiversity trends. It works by processing species occurrence cubes to automatically calculate standardised indicators (e.g., species richness and change over time), quantify uncertainty, and present results through customizable maps and time series. It aims to improve the accessibility, reproducibility, and reliability of biodiversity analyses to better support conservation and environmental decision-making.
The pdindicatoR package was developed to facilitate producing phylogenetic diversity (PD) maps from user-provided phylogenetic trees and GBIF species occurrence cubes. The workflow output highlights phylogenetic diversity hotspots and quantifies the proportion of PD currently safeguarded within existing protected areas. The package can be used as a tool to locate hotspots of phylogenetic diversity, guide conservation planning by identifying priority regions for protection and assist with long-term monitoring and reporting on PD conservation status.
The impacts of alien taxa indicators present a straightforward method for estimating the harm caused by alien (non-native) species, using freely available data and a clear, step-by-step process. As non-native species spread and multiply, they can seriously affect local plants, animals, and entire ecosystems, not to mention impacts on agriculture and health. By combining information about where these alien species occur (from online databases) with the evaluations of their ecological effects (from an international standardised process that gathers information on impacts and collates them into a standard score), we developed a practical tool that gives an “impact value.” This value reflects both how widespread a species is and how serious its negative effects can be. Researchers, conservationists, and policymakers can use these values to identify which non-native species are likely to be problematic, allowing managers to address the urgent future problems. This method thus helps guide actions to protect biodiversity and maintain healthy ecosystems into the future.
The R package dubicube supports exploratory analysis, uncertainty quantification, and evidence-based interpretation of biodiversity indicators. It tackles the need to assess the reliability and interpretability of biodiversity indicators derived from species occurrence data by implementing methods to evaluate data robustness, identify limitations in spatial, temporal, and taxonomic coverage, and quantify how sensitive indicators are to individual species. Uncertainty is explicitly estimated using resampling techniques, allowing confidence intervals and effect classifications to support cautious interpretation of trends. Together, these approaches reduce the risk of overconfidence in indicator results and improve transparency in analysis. All proposed methods are implemented in the R package dubicube, which supports exploratory analysis, uncertainty quantification, and evidence-based interpretation of biodiversity indicators.
The b3verse is an integrated ecosystem comprising eleven R packages and the b3data data package. The b3verse consolidates biodiversity indicator workflows into a coherent, reproducible, and open-source framework, covering general biodiversity indicators (e.g. b3gbi), phylogenetic diversity (pdindicatoR), alien species impacts (impIndicator), uncertainty and robustness assessment (dubicube), and modelling tools such as dissmapr and invasimapr. The ecosystem follows strict development guidelines, includes automated testing and continuous integration via R-universe, and is permanently archived on Zenodo. Comprehensive documentation and tutorials ensure accessibility, and the modular design provides the technical foundation for cloud-based dashboards and policy-oriented applications.
Case studies
The usefulness of B-Cubed’s tools was demonstrated through four case studies, which spanned diverse environments, regions and challenges to maximise relevance to stakeholders.
In this case study, the B-Cubed workflows were tested for Flanders, a region of Europe where species occurrence data are abundant. This case study is accompanied by a dashboard and indicator fact sheets.
Reliable and up-to-date information on biological invasions helps governments, scientists, and land managers understand where invasive species occur, how they are spreading, what impacts they are having, and whether management actions are working. South Africa produces a national report on the status of biological invasions and their management every three years (the ‘status report’). These status reports link foundational research with the monitoring and evaluation of management interventions; support policy and management; and help the country meet national and international reporting commitments.
The status report is based on a suite of indicators which explicitly consider biological invasions in terms of pathways of introduction and spread, the status and impacts of alien species, the degree to which sites are invaded and impacted, and the effectiveness of interventions. These indicators are calculated using information from many different sources, including biodiversity surveys, research projects, and citizen science programmes. A major challenge has been combining the occurrence data from these various sources into a reporting system that is efficient, transparent, reproducible, and aligned with international frameworks.
The 2025 status report has served as a case study for the B-Cubed project by implementing its data cubes, models, and indicators. The project has made South Africa’s national reporting on biological invasions more efficient, transparent, and scientifically robust.
- The alignment of indicators: The B-Cubed project supported the revision of the indicator framework, and improved the alignment of the indicators with international reporting requirements.
- The process of compiling a list of alien taxa for South Africa: Through improved documentation and the standardisation of data formats and protocols, the process of updating the species list has been substantially improved. Best practices are now followed – the species list is aligned with biodiversity information standards (i.e., Darwin Core) and is presented in a FAIR (findable, accessible, interoperable, and reusable) and tidy manner – and repeatable workflows facilitate tracking changes, and ensure that future updates are transparent and efficient.
- Mobilisation of spatial data: The B-Cubed project has addressed several challenges in the process for downloading and analysing occurrence data for alien species in South Africa, by improving:
- Processing time: The processing time for species occurrence data has been reduced from weeks to hours.
- Data standardisation and flexibility: Species occurrence cubes integrate datasets from various sources into a common usable format across three dimensions (taxonomic, spatial, and temporal). Using these cubes and implementing data-quality filters (e.g., coordinate uncertainty) has improved data quality.
- Scalability and repeatability: Standardised workflows make it easy to download occurrence data at several spatial scales (e.g., quarter-degree grid cells and biogeographical regions; for an example see the figure below), and as each download includes metadata describing the SQL query, contributing datasets, and a persistent download link, our analyses are now transparent, reliable, citable, and easy to reproduce.
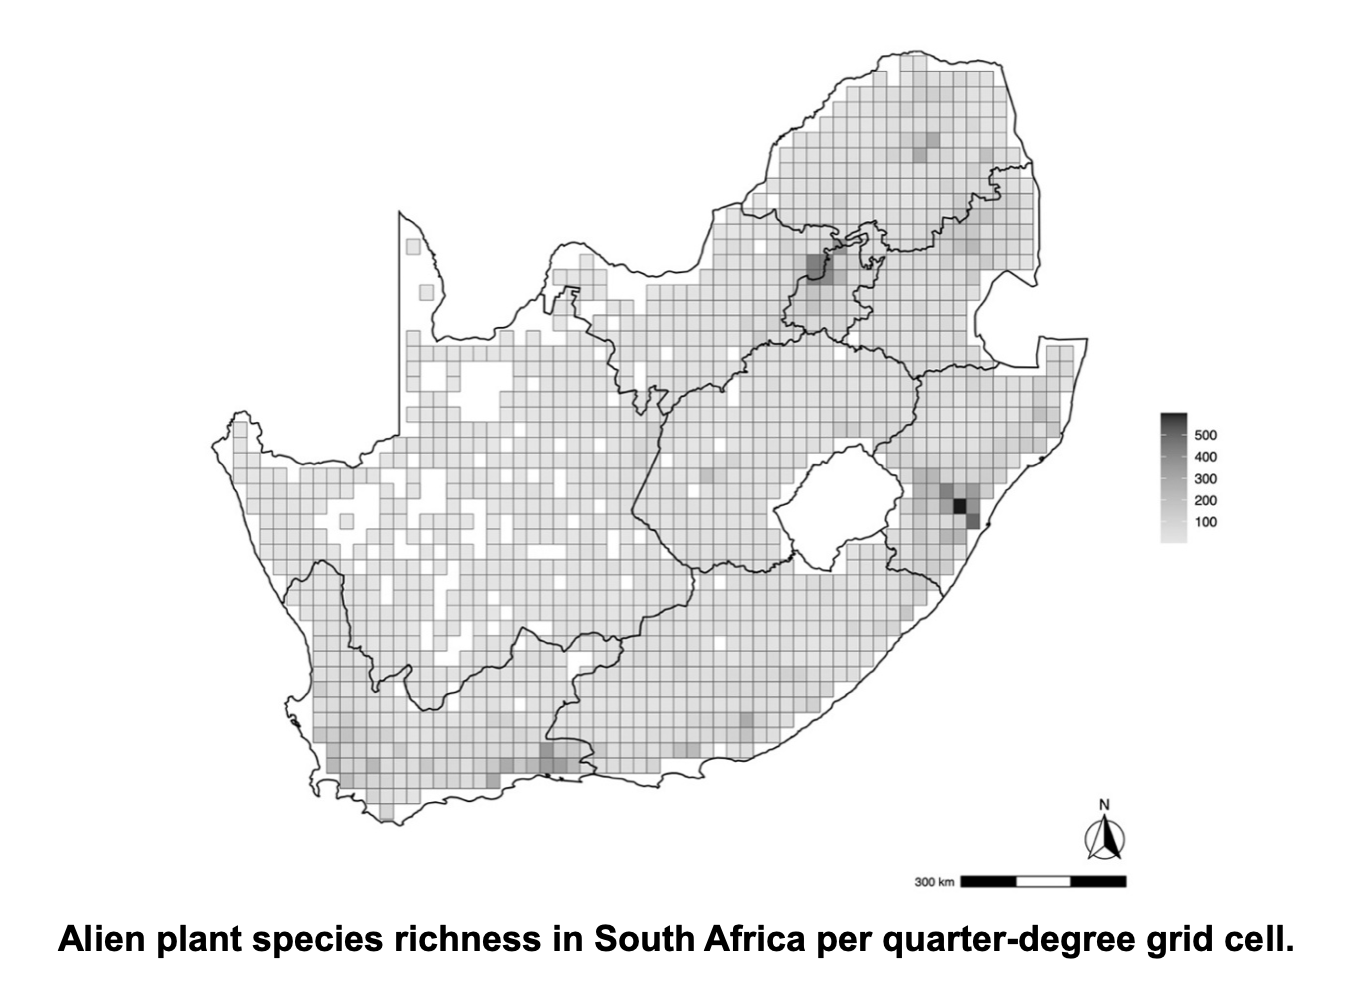
Several other B-Cubed products provide opportunities to further strengthen the status report, and are flagged for future incorporation. For instance, data products such as similarity and dissimilarity cubes offer new approaches for assessing invasion debt and forecasting future invasions; several indicators on biodiversity and the impact of alien species developed through the B-Cubed project will need to be refined before they can be integrated into the status reports; and tools to estimate uncertainty in indicators will greatly improve their robustness and interpretation.
Overall, the case study has demonstrated how the B-Cubed project’s outputs can help turn biodiversity observations into information that supports policy and management. It also provides a practical example that other countries can adapt to strengthen biodiversity monitoring and reporting to support management and evidence-based decision-making.
Policy brief (https://zenodo.org/records/21977633): This brief covers practical lessons from South Africa for how standardised and regularly updated species lists, repeatable workflows, and a clear indicator framework facilitate the reporting on biological invasions.
The status report (http://dx.doi.org/10.5281/zenodo.20204153): The report on the status of biological invasions and their management in South Africa in 2025.
Species-level assessment under Article 17 of the EU Habitats Directive requires reliable information on species distributions, populations and trends across Europe. However, biodiversity data are often fragmented, unevenly distributed in space and time and difficult to integrate into reporting workflows.
The B-Cubed stakeholder-driven case study explored how open biodiversity data, particularly occurrence records available through GBIF, can complement national monitoring and support more reproducible and consistent species-level assessments and reporting.
From open data to species assessment
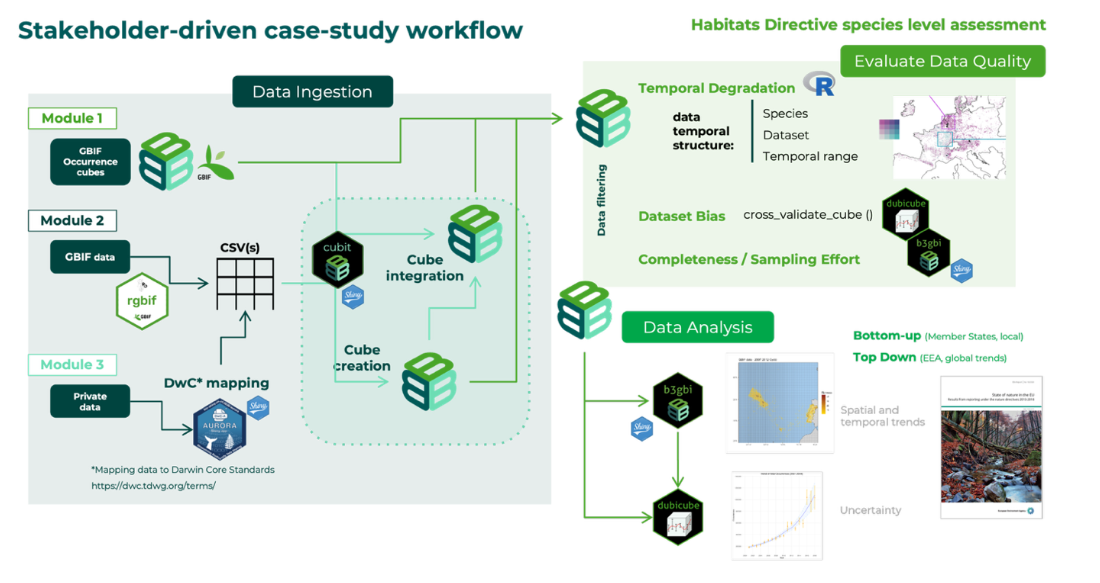
The case study developed and tested a reproducible workflow for integrating open occurrence data into Habitats Directive species assessments. The workflow combines data ingestion, harmonisation and data quality assessment, allowing occurrence data to be organised into spatially and temporally consistent data cubes for species-level analysis.
The workflow also incorporates methods to assess data completeness, uncertainty and potential biases, helping potential users understand where occurrence data can provide robust evidence and where additional investment or data mobilisation is needed. By making these assessments reproducible and transparent, the workflow contributes to B-Cubed’s broader goal of improving the usability and consistency of open biodiversity data for policy applications.
Main results
The availability of biodiversity data has increased substantially.
GBIF occurrence records for Habitats Directive taxa increased markedly over the years. This increase reflects the growing availability and mobilisation of biodiversity data rather than a direct change in species populations.
Data availability and sample coverage vary considerably across Europe.
Spatial completeness differed substantially among Member States. Countries with established biodiversity data infrastructures and extensive data mobilisation showed higher levels of coverage, while lower completeness highlighted areas where additional data mobilisation could improve the evidence available for assessment.
Temporal patterns in data available through GBIF can be assessed to identify reliable signals of change.
Although occurrence data originate from diverse sources and sampling approaches, their temporal structure can be quantified at different scales. The analysis of temporal degradation identified substantial variation in the strength of temporal signals across species and dataset levels.
GBIF data can complement national monitoring.
Open occurrence records available through GBIF can provide valuable additional evidence for assessing species distributions and ranges. When their spatial and temporal limitations are accounted for, it can help identify gaps in existing information and extend the spatial and temporal evidence available for species assessments.
Reproducible workflows increase the usability of open data.
By combining standardised data processing and quality assessment, B-Cubed provides a reproducible approach for organising heterogeneous occurrence data into structured datasets that can support species-level analyses across reporting cycles and geographic areas.
Open data can work as a complement to structured monitoring.
The case study highlights the value of combining open occurrence data with existing national monitoring. This complementary approach can be particularly useful in regions where monitoring coverage is limited or with less developed monitoring programmes.
Stakeholder engagement and policy relevance
Stakeholder engagement was conducted at different stages of the case study, involving Member State representatives, GBIF National Nodes, European institutions, biodiversity experts and other stakeholders. These interactions helped identify species-level assessment and reporting under Article 17 as a priority challenge, explore how occurrence data available through GBIF are currently used, and identify barriers and opportunities for their integration into national biodiversity reporting.
The results highlighted that data quality, trust and fitness for purpose remain important barriers to the uptake of open occurrence data in official reporting. Stakeholder engagement therefore provided important context for interpreting the technical results and for discussing how open biodiversity data could be incorporated into future reporting processes.
Explore further
CubitA user-friendly tool for creating biodiversity occurrence cubes, supporting the integration of data from different sources. The R Shiny interactive application provides an automated workflow for generating species occurrence cubes from user-provided datasets.Policy BriefKey messages and recommendations from the stakeholder-driven case study for improving species assessment and reporting under the Habitats Directive.GBIF taxonomic keysA curated resource linking scientific names reported under Article 17 for the 2001–2006, 2007–2012 and 2013–2018 reporting cycles to GBIF taxonomic identifiers, supporting the integration of Habitats Directive species data with occurrence data available through GBIF.Wetlands are among the world’s most diverse and productive ecosystems, providing essential services and supporting a wide range of species. Yet they continue to face degradation and conversion. Monitoring biodiversity in these ecosystems is therefore essential—but do we currently have the data needed to understand whether biodiversity is being maintained or declining?
B-Cubed's case study explored this question across the global network of Wetlands of International Importance, designated under the Convention on Wetlands. The study assessed the availability of open biodiversity occurrence data through the Global Biodiversity Information Facility (GBIF) and examined whether these data are sufficient to monitor biodiversity status and trends. The results reveal major gaps in the information needed for effective, consistent monitoring.
Key results:
- The foundations for monitoring are often missing: Seventy-four percent (1,872) of Wetlands of International Importance have Ramsar Information Sheets that are more than six years old. In addition, 35% (891 sites) lack digital boundaries, making it difficult to reliably link biodiversity observations to individual wetlands.
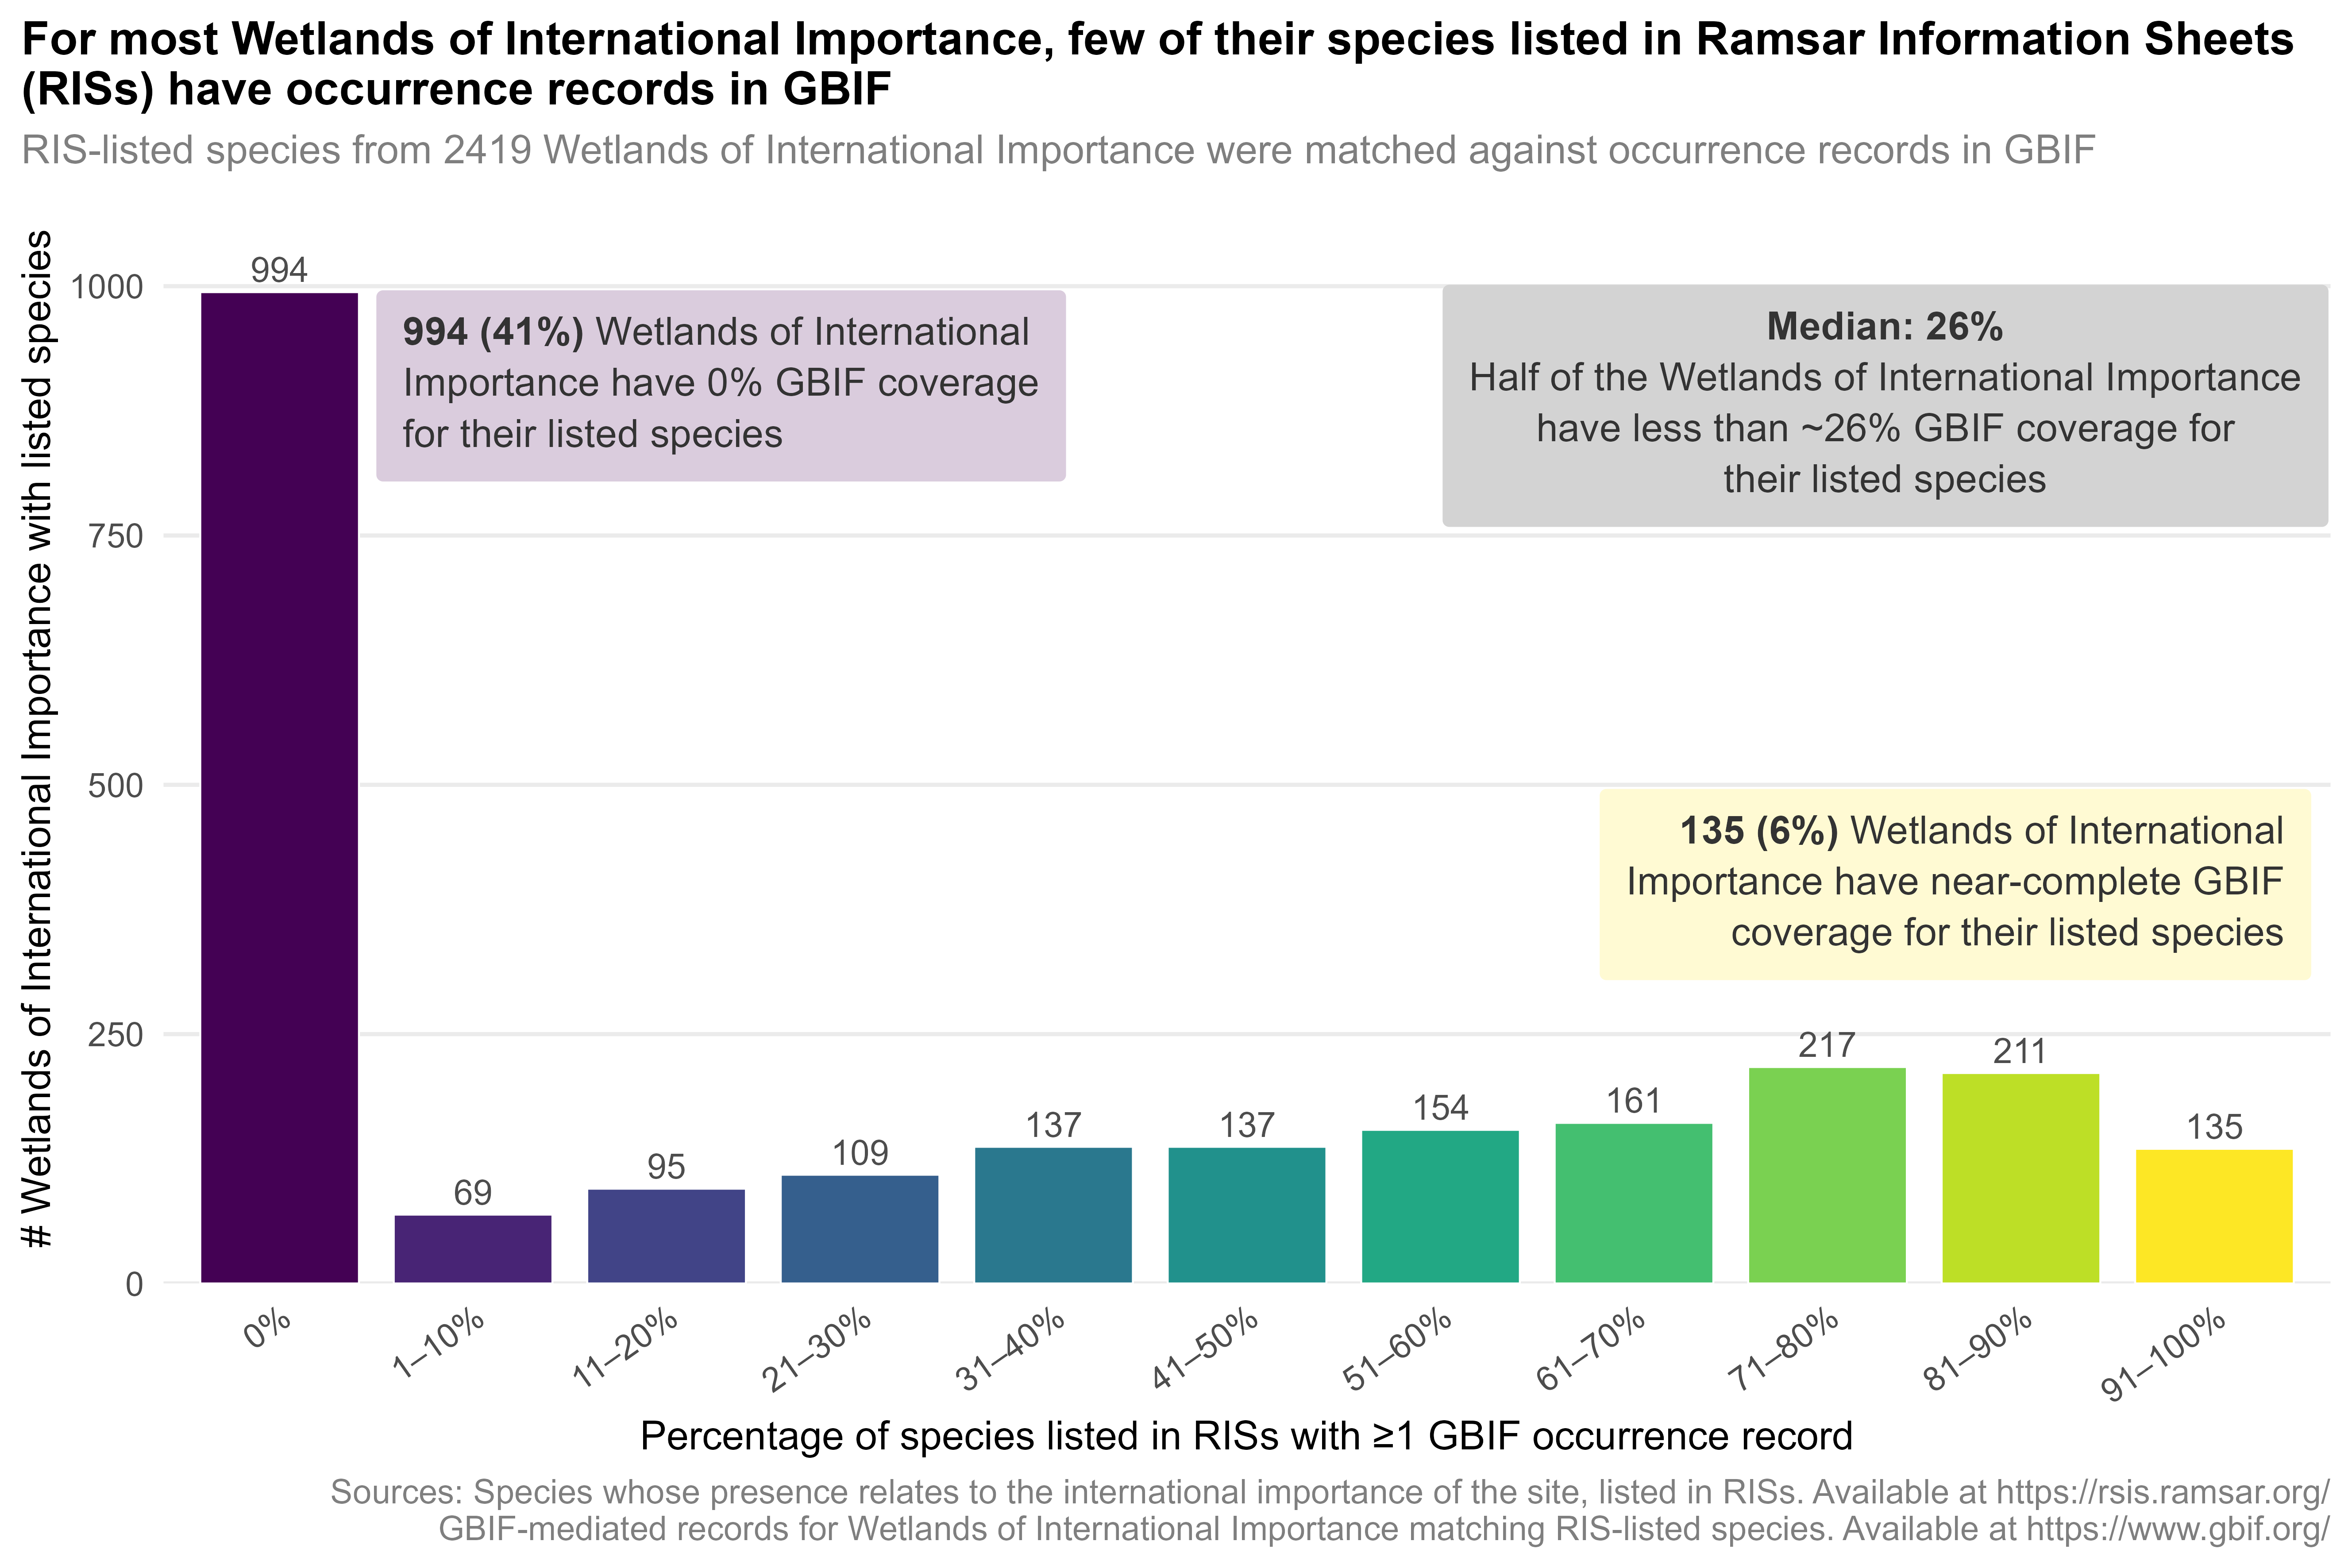
- Open biodiversity data offer great potential—but coverage remains incomplete: GBIF provides access to biodiversity records from museums, research institutions, citizen science initiatives and other sources. These open data can complement information reported through the Convention on Wetlands and offer a cost-effective resource for biodiversity monitoring. Among sites with species listed in their Ramsar Information Sheets, 41% (994 sites) had no matching occurrences in GBIF, while only 135 sites (around 6%) had near-complete coverage of their listed species.
- Major geographical inequalities remain: Biodiversity data coverage is highly uneven around the world. Coverage of Ramsar-listed species is strongest in Western and Northern Europe but remains particularly limited in Central Africa, South and Southeast Asia, and parts of the Americas.
- Progress is being made—but not fast enough: The availability of biodiversity records has increased steadily over time. In 1971, only 10% of wetlands with listed species had at least one matching occurrence in GBIF. By 2023, this had risen to 45%. Despite this progress, the gap remains substantial: by 2023, 55% of sites still had no GBIF occurrences matching species listed in their Ramsar Information Sheets.
Connecting data systems for better monitoring
The case study identified a clear way forward: strengthening the connection between the reporting systems of the Convention on Wetlands and open biodiversity data infrastructure such as GBIF.
Contracting Parties are encouraged to keep Ramsar Information Sheets up to date, use standardised taxonomies and provide site boundaries in digital form. At the same time, stronger interoperability between GBIF and the Convention could enable a two-way flow of information: species data reported through the Convention could improve open-data coverage, while countries could use the wider range of data available through GBIF to assess biodiversity at their sites more comprehensively.
Closing the gap
The findings show that open biodiversity data have enormous potential for monitoring the world's most important wetlands—but current coverage is not yet sufficient for reliable network-wide assessments.
Closing biodiversity data gaps will require investment in the foundations of monitoring: up-to-date site information, standardised species data, digital boundaries, geographically precise observations and sustained data collection over time.
By improving the flow of information between national reporting systems and global open-data infrastructures, and by prioritising regions where gaps are greatest, biodiversity data can become a much stronger foundation for conservation decisions and the effective monitoring of Wetlands of International Importance.
Resources & Publications
To ensure reproducibility and transparency, the project developed guides, tutorials, and training sessions, and made all publications, milestones, deliverables, and software publicly available.
The B-Cubed documentation website provides unified access to all guides, tutorials and technical documentation produced by the B3 project. It is home to the specification for species occurrence cubes, a format allowing easier analysis of species occurrence data. Users can create these cubes through services provided by the Global Biodiversity Information Facility (GBIF). The website also includes tutorials on how to process and use these cubes, especially with "b3verse", a collection of R packages designed for this purpose. Finally, it contains a best practice guide for the development of research software. All content is open access, searchable and regularly updated from its respective sources.
The B-Cubed software development guide establishes the high-level quality requirements for all software tools, computational workflows, and digital resources developed within the consortium. It establishes a consistent open-source development lifecycle that promotes transparency, collaboration, and reuse both within and beyond the project.
The guide provides clear instructions and examples on repository management, inclusion of useful metadata, licensing under the permissive MIT licence, and the adoption of collaborative workflows such as the GitHub flow. Specific best practices are detailed for development in R and Python, ensuring consistency and technical robustness.
Quality assessments confirm that B-Cubed software tools comply strongly with the defined openness and quality standards (81% overall compliance), with continuous improvement observed throughout the project. The interoperable “b3verse” of R packages and associated documentation ensures robust, reusable and sustainable digital outputs.
The main technological achievements of B-Cubed are highlighted with a series of training sessions on working with biodiversity data cubes and indicators. They focus on the SQL service to download biodiversity data cubes from GBIF-mediated data, R packages developed throughout the project, using biodiversity indicators and other tools. The training sessions and their recordings present the project’s results in an accessible and engaging way, making them easier to understand and use.
In addition to the hands-on training session, B-Cubed tools have been showcased on numerous occasions. As a result, the project has acquired a library of recorded training sessions that can be used for better understanding of B-Cubed developments.