As global biodiversity faces immense pressure from climate change, land-use change, and an expanding human footprint, the ability to monitor and analyse biodiversity trends effectively is crucial. Therefore, biodiversity indicators have become indispensable tools for governments, NGOs, researchers, and policymakers. They provide vital insights into biodiversity trends, helping shape conservation strategies and inform environmental policies. With this in mind, the b3gbi R package has been developed to assist researchers in leveraging the vast data available from resources such as the Global Biodiversity Information Facility (GBIF).
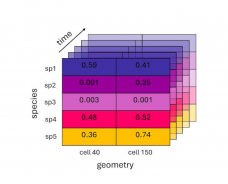
Developed as part of the B-Cubed project, b3gbi addresses the increasing need for standardisation of biodiversity data and reproducible workflows to calculate biodiversity indicators, making use of the extensive data available from GBIF. The b3gbi package provides researchers with robust capabilities to analyse changes over time and detect spatial variations in biodiversity. By leveraging the power of data cubes, b3gbi enables streamlined assessments of biodiversity metrics, offering insights into how environmental factors or human activities may influence biodiversity patterns.
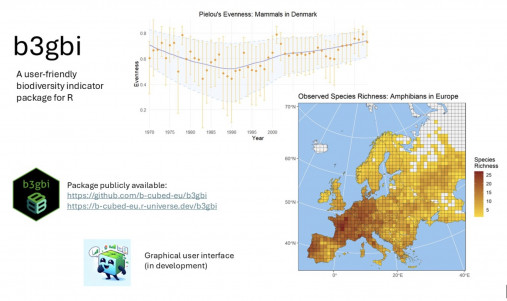
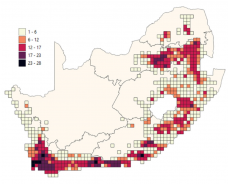
The main strengths of b3gbi are its flexibility and ease of use. Rather than providing rigid workflows, the package offers a set of easy-to-use functions that allow users to quickly calculate a variety of general biodiversity metrics, such as species richness, evenness, rarity, Shannon-Hill and Simpson-Hill diversity, taxonomic distinctness, and occupancy turnover. Furthermore, the package is designed to be extensible so that other indicators can be added over time. It also includes flexible options for calculating and displaying uncertainty, smoothed trends, and exploring different resolutions, timescales, and spatial scales. This approach affords researchers the adaptability to tailor analyses to their specific data and research questions.
In addition to its analytical capabilities, b3gbi generates publication-ready figures and can be easily customised using a variety of visualisation options, while more advanced users can take advantage of its integration with ggplot to further refine their plots. The package is under active development to include a graphical user interface for those with no programming knowledge and will be deployed to the cloud, making it easily accessible to anyone through a web browser. Such accessibility ensures that the tool can be used by a wide audience, from researchers and educators to policymakers, facilitating broader engagement with biodiversity data.
As part of the ongoing efforts to enhance biodiversity monitoring tools, the b3gbi is now accessible on the Horizon Results Platform.
In summary, b3gbi is a flexible and powerful tool for examining biodiversity trends comprehensively. As development continues, the inclusion of web-based access, a graphical user interface, additional indicators, and integration with the broader B-Cubed universe of tools promises to expand its utility and impact, offering a valuable resource for those working to understand and protect our planet's diverse ecosystems.