News

New B-Cubed supported paper introduces the uniform approach for improved habitat suitability models

30 November 2023

B-Cubed is delighted to share that the project has partially contributed to the publication of a new paper – Uniformly sampling pseudo-absences within the environmental space for applications in habitat suitability models. One of the authors of the paper – Duccio Rocchini – is part of B-Cubed’s team and a full professor at Alma Mater Studiorum University of Bologna. 

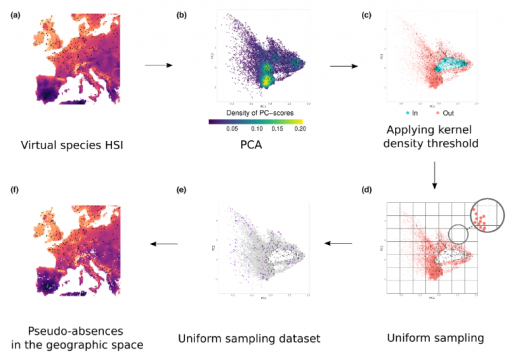
The paper introduces a novel methodology – the uniform approach – to address issues in generating pseudo-absences for habitat suitability models. By systematically sampling pseudo-absences within a portion of the environmental space delimited by a kernel-based filter, the proposed method effectively reduces sample location bias and class overlap, demonstrating comparable predictive performance while ensuring the representation of environmental conditions across the study area.

Read the full paper here.

Flowchart representing the step-by-step procedure for implementing the uniform approach: 
(a) habitat suitability index (HSI) of the i-th virtual species (VS; lighter colors indicate higher habitat suitability and black dots represent presence points in the geographical space); (b) Principal component analysis (PCA) performed on the environmental variables in the study region (lighter colors indicate high PC scores densities and black dots represent the presence points within the environmental space); (c) application of the kernel-based filter, which splits the environmental space into two subspaces associated with either the environmental conditions more suitable for the species (in blue) or those associated with less/not suitable environmental conditions (in red; with black dots still depicting presence points); (d) pseudo-absences are uniformly sampled across a sampling grid of a chosen resolution overlaid to the 2-dimensional environmental space. Specifically, pseudo-absences are sampled within each cell of the 2-D grid. The inset map shows an example of a grid cell at the boundary of the environmental space (i.e. a grid cell containing a low density of pseudo-absences), black dots represent presence points; (e) the purple dots represent the pool of randomly selected pseudo-absences after running the uniform sampling approach; (f) the white dots represent the selected set of pseudo-absences after running the uniform sampling approach, but displayed in the geographical space this time, black dots still represent presence points from the focal virtual species. The sample prevalence and the number of pseudo-absences sampled within each cell of the sampling grid were defined as prev = 1 and n.tr = 5, respectively, in the paSampling function.